Smart Microscope
---Research Dashboard
UI/UX Design | Website based Design
Project in Smart Microscope Group in DALI lab at Dartmouth College| 2024.1
Research: User Interview, Literature Review, User A/B Testing
Tools: Figma, Sketch
OVERVIEW
Smart microscope is the one that displays digital slides of the tissue, but has the user interface and physical knobs of a traditional microscope. The efficiency of traditional microscopy, but with the power of digitized whole slide images and machine learning. This project is what I am doing in the DALI lab at Dartmouth College.
The research dashboard is a tool for those like AI experts or pathologists to check the models running performance, make edition and apply to adding new models on microscope.
Main Objective of Smart Microscope

Novel Microscope for Telepathology:
Traditional microscopes are easy to use. Often, a diagnosis can be issued in a fraction of a second. This ease of use results in extreme efficiency, which in turn saves costs, and most importantly, saves time for patients who are waiting on a cancer diagnosis.
But, traditional microscopes do nothing to accommodate Machine Learning applications.
We propose to build a prototype microscope: one that displays digital slides of the tissue, but has the user interface and physical knobs of a traditional microscope. The efficiency of traditional microscopy, but with the power of digitized whole slide images and machine learning.
Description
and schematic
I'm an UI/UX designer in this project group.
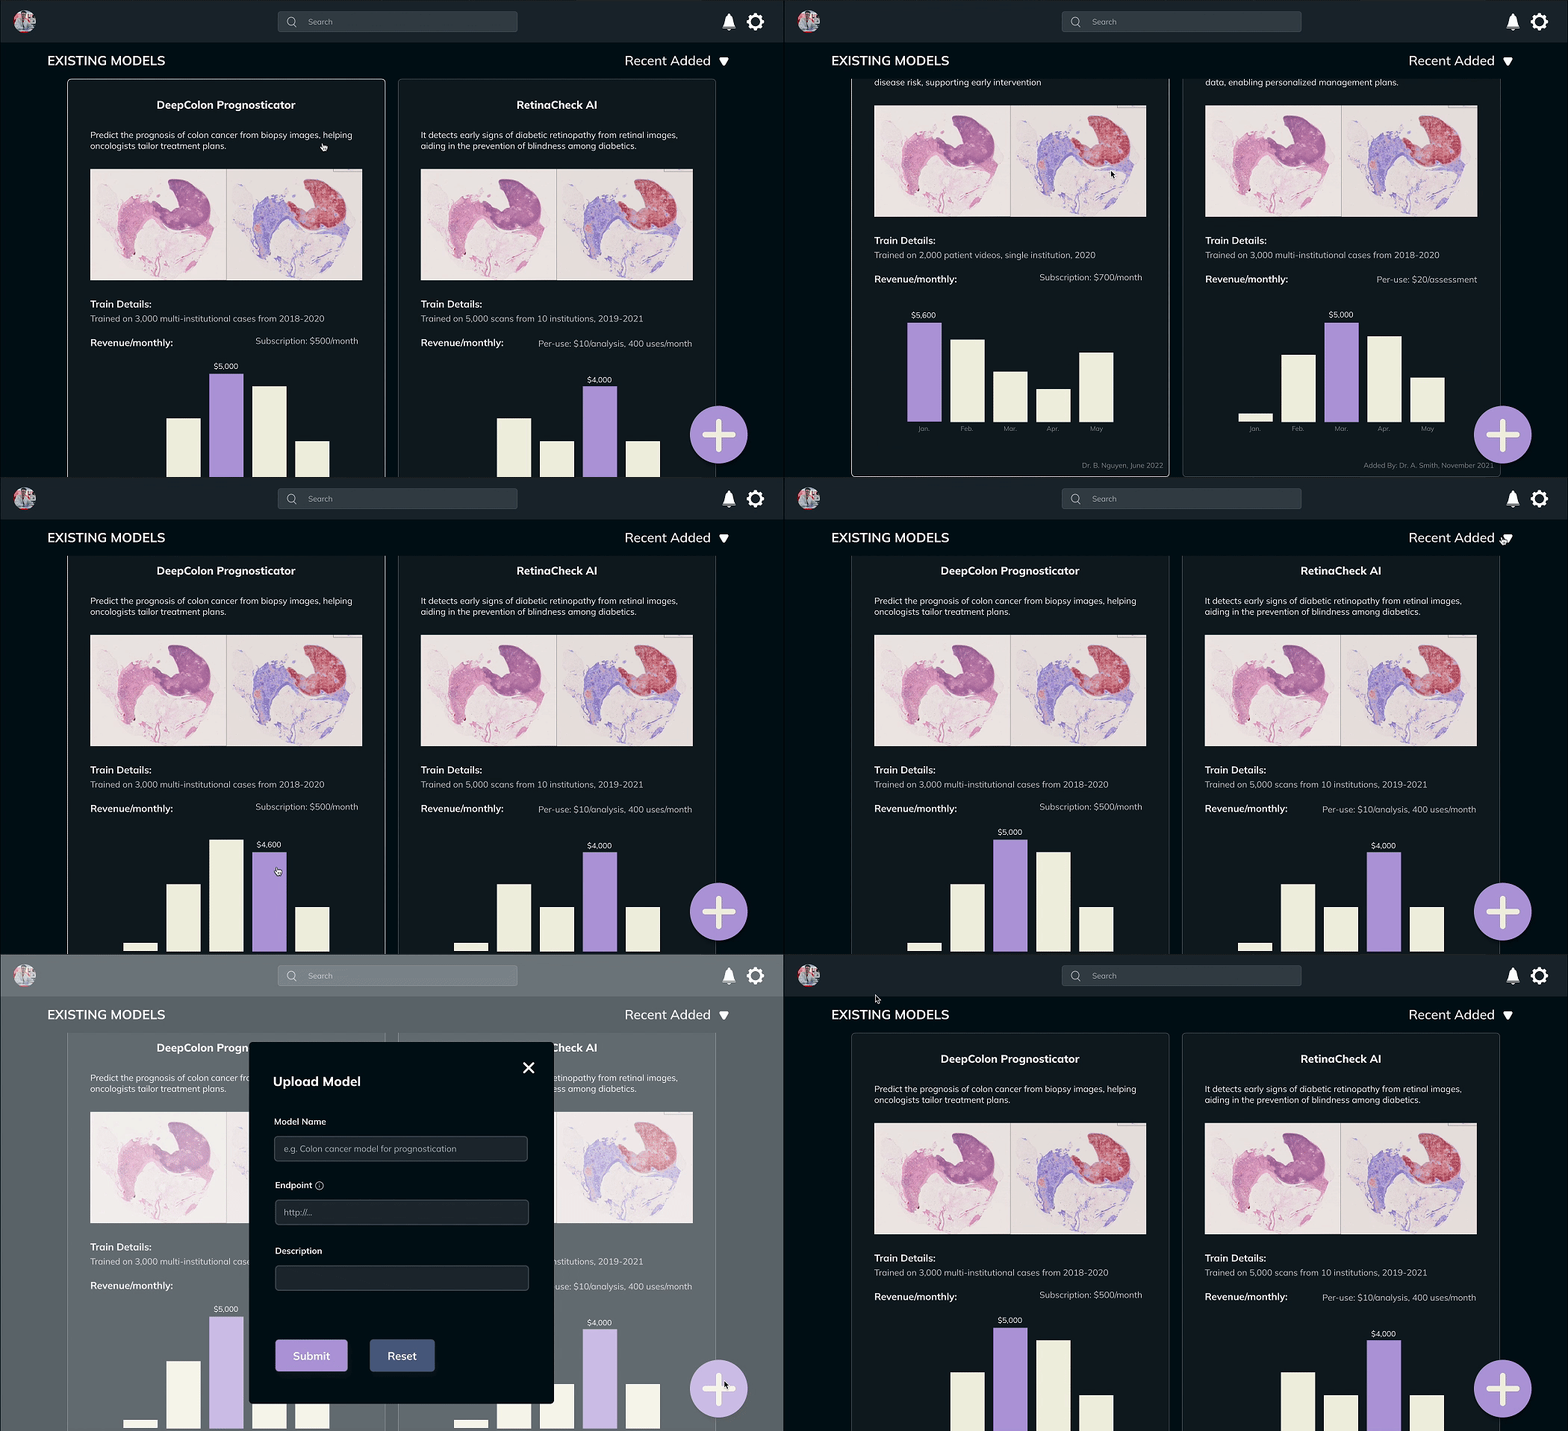
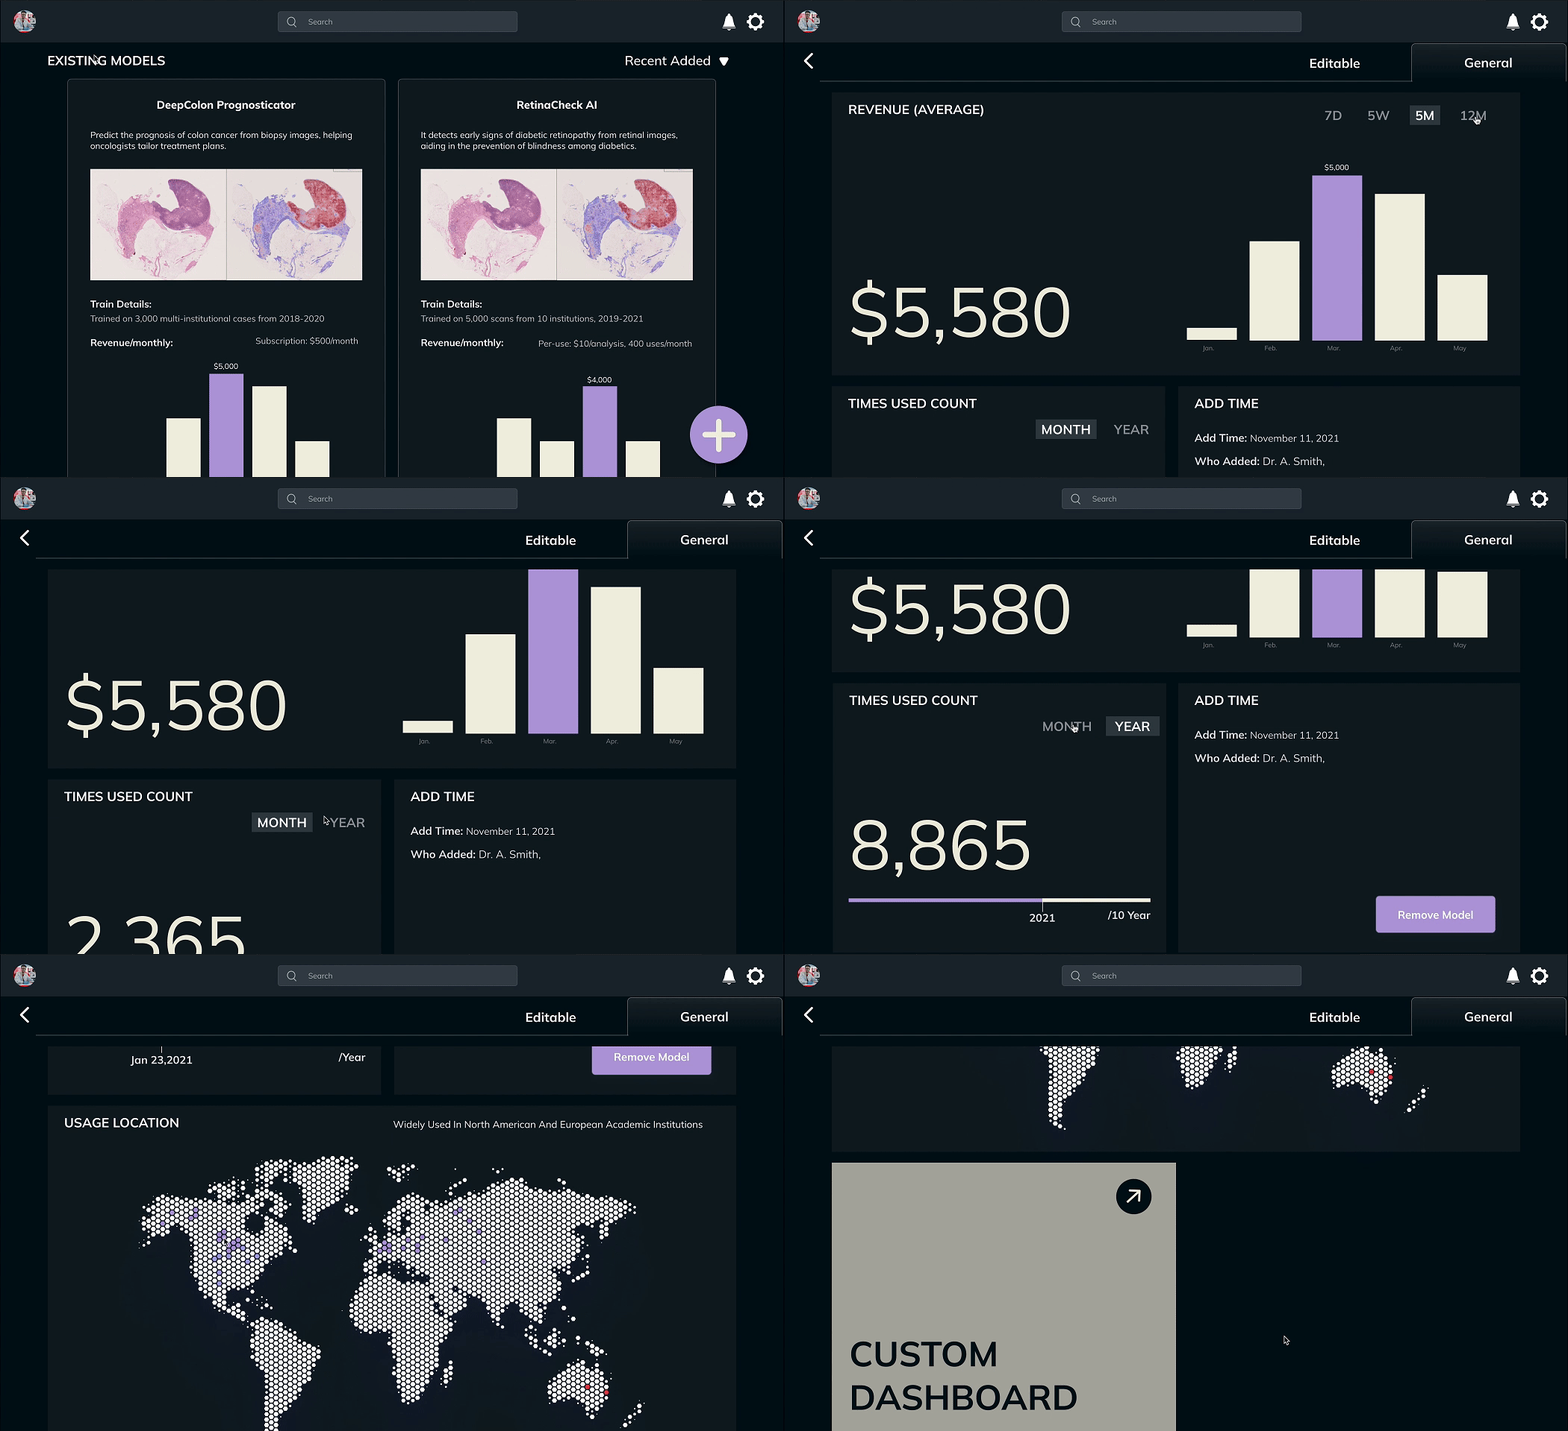
In this project, I was tasked with designing a user interface for a website based platform where users, after logging in, are directed to a dashboard displaying a list of machine learning models they have added to the "App Store (which can be applied on the microscope)."

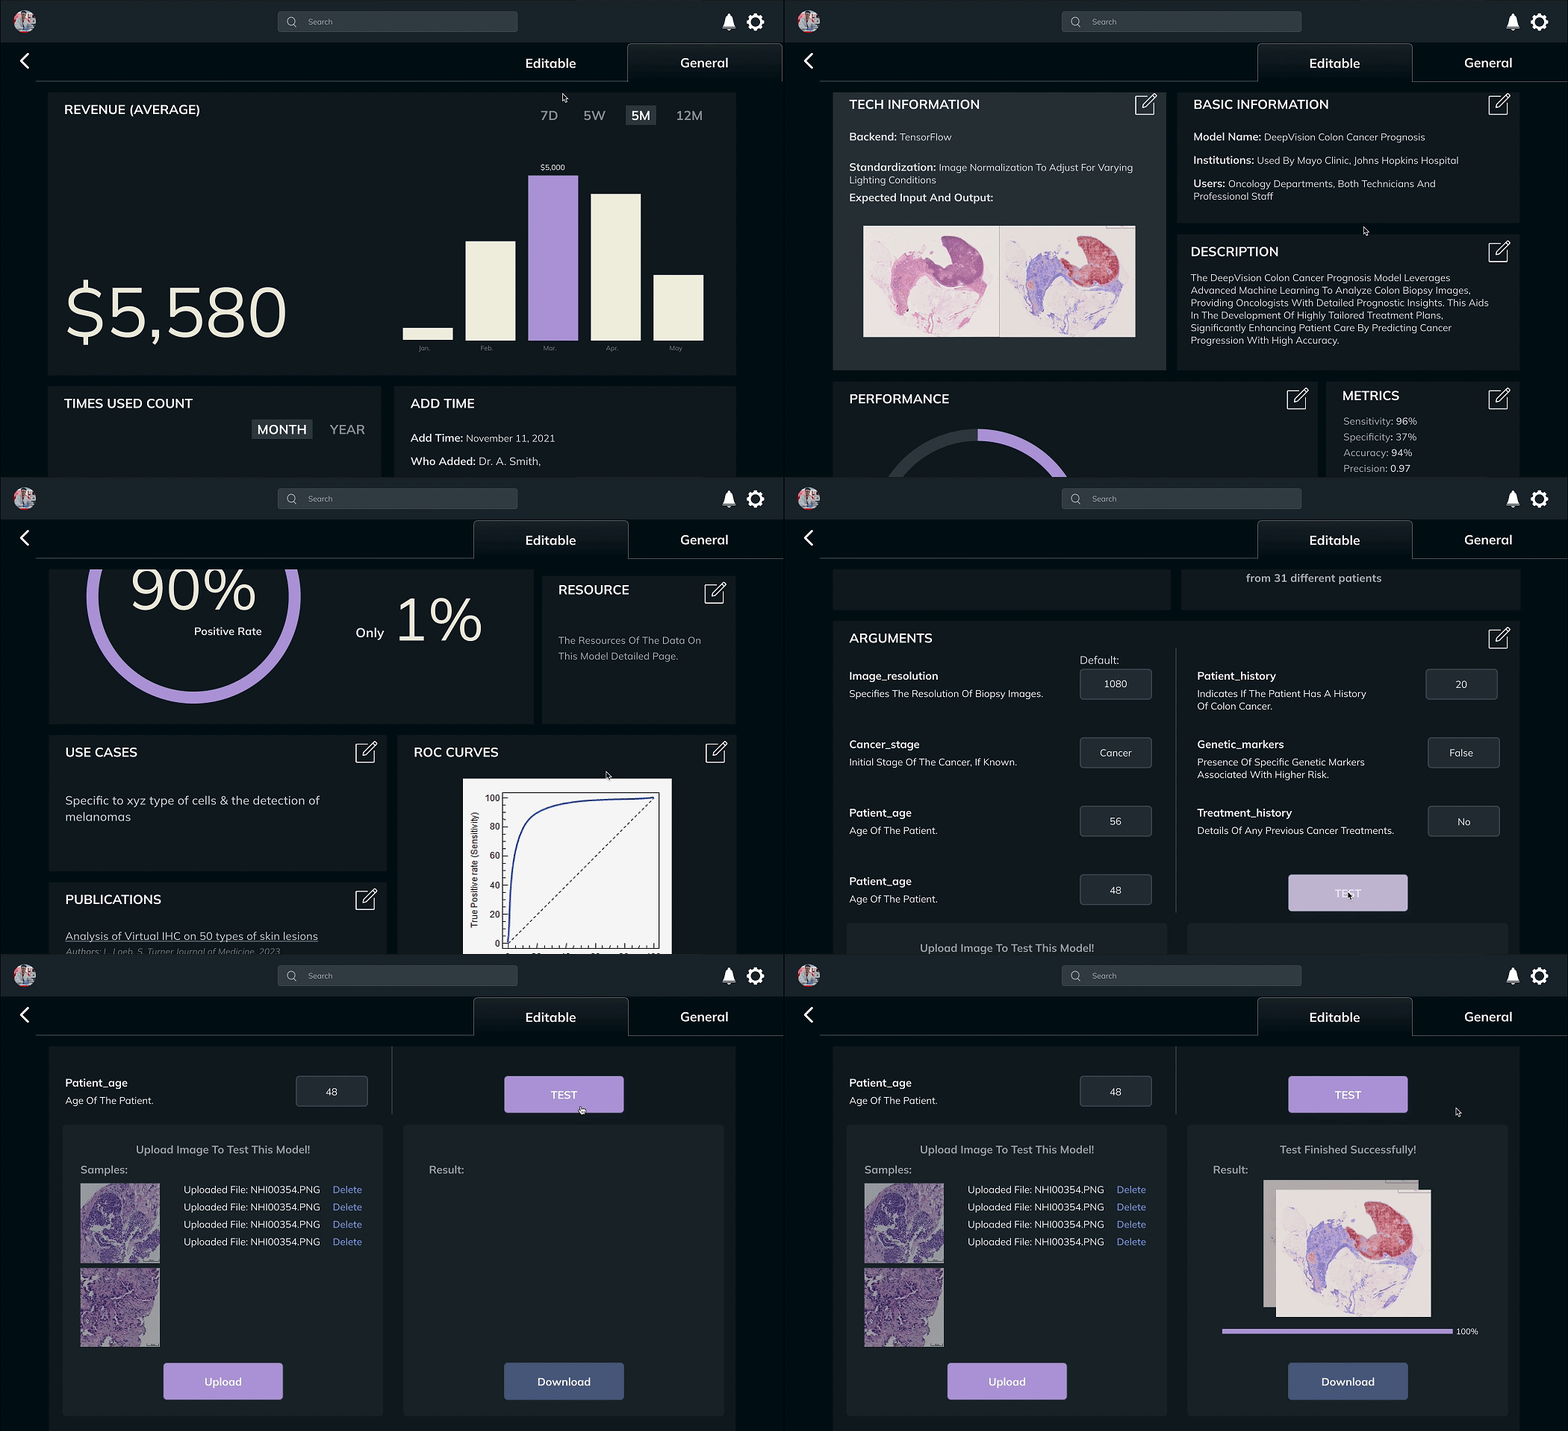
Clicking on a model opens a detailed view showcasing the model's name (e.g., "Colon Cancer Prognostication Model"), its institutional users, the user demographics (technicians or professional staff), and its usage pattern (overnight or throughout the day).

Additionally, the interface includes an "Add" button that triggers a form. Users can submit a new model by filling out the form with the model's name and three endpoint URLs. Upon approval, the model is added to the app store.

User Research
I interviewed some machine learning experts and pathologist who may use AI models for clinical uses.

User Groups
2 main types of users --> people who are using it for research, non-experts, they are aware of what Machine Learning does but doesn't know how to program/do it themselves, they might be evaluating this for research or clinical use and perusing different models, picking a model according to their needs by testing with some sample images, probably most important user type.
Another type of user that is evaluating for their own use case which is more technically advanced, would want to see nuts and bolts of technical stuff (e.g. JHU, UCLA people who might want to evaluate model), they might not trust synopsis and want more information.
I should be careful that the dashboard I design can meet the needs of both types of users.
The information users want to have on the dashboard:
1. name of models (e.g. colon cancer machine learning train model for prognostication)
2. what institutions were using it
3. what level of faculty were using it, was it technicians or a professional staff or both,
4. what time of a day are they using it(an overnight thing or they using it throughout the day in real time)
5. how many times this model has been used
6. pay-for-use model
7. revenue it has made
8. description of this training models
research pay model:
Subscription-based
Per-use
Per-scan
Hifi Prototype
1st Version
Feedback:

Visualize money from each model on Home Page.

Add text to the bar to hint what to type in
How attached are we to the language of "Endpoint"? Overly technical?
Endpoint on form is a get request, ask using that end point what are all params for your models, they will give back response that will include other endpoints (how to give and retrieve image, how to check if image done processing) also list all params they need for model, send WSI, need to input cell diameter or give spring, and then whatever outputs are (generalizable). We just tell the people what data types they are allowed to give us

Most important info to display on home page is what model is expected to do and what it takes as input --> visual display of how model works, what it takes. More detail if someone clicks into model about what model expects, outputs, etc.
2 different levels --> some people might not understand higher level technical descriptions, and so some lower level descriptions could help developers who are less advanced programers. More advanced arg description for more advanced devs.
For many models, defaults may be only options parameter-wise
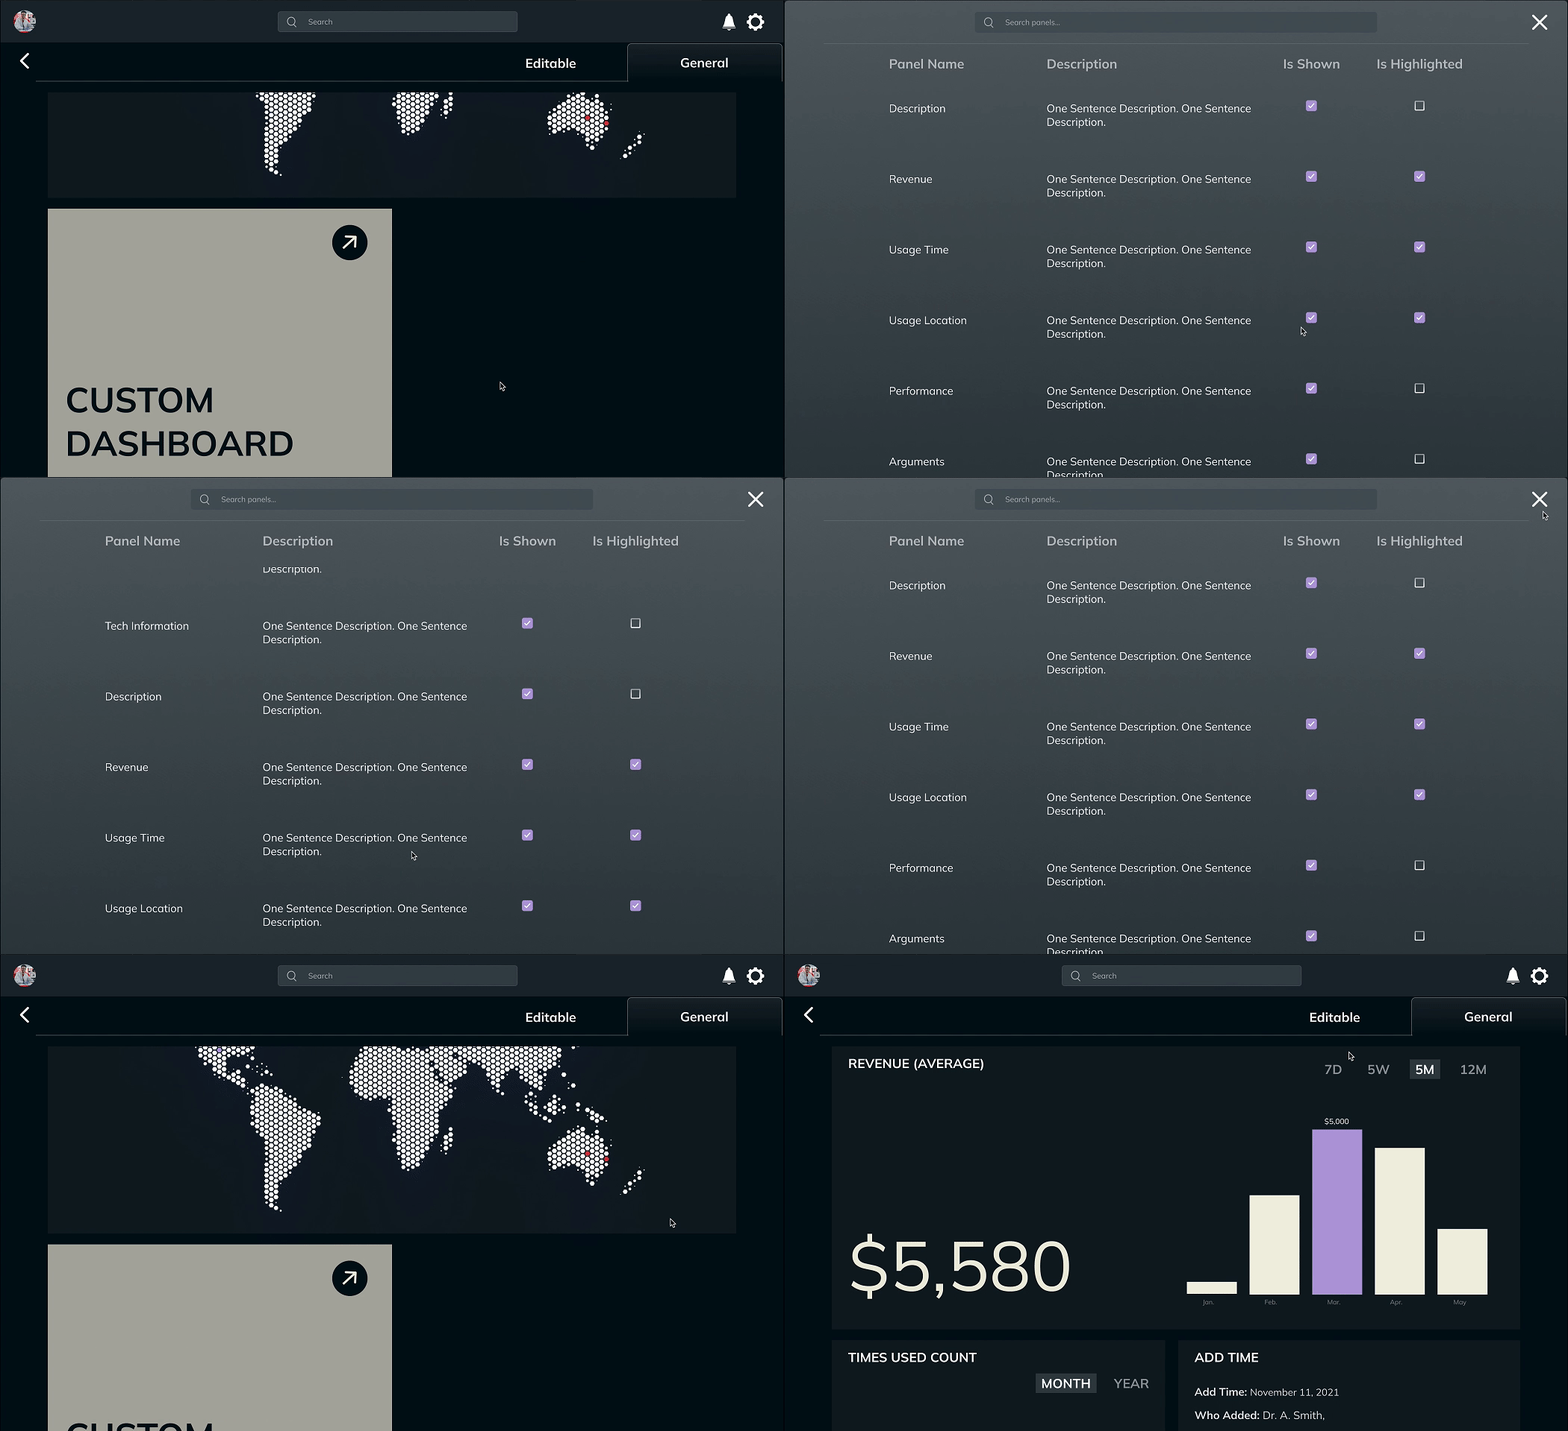
Would be useful to see general geographic location --> where is model being used from? if model is being used somewhere it is not approved/somewhere outside of its license, that would be good to know.
expand weekly and annual revenue
Final Version


Smart Microscope
---Annotator Tool
UI/UX Design
Project in Smart Microscope Group in DALI lab at Dartmouth College| 2024.3
Research: Industry Research, User Interview, Field Study, Usability Testing
Tools: Figma, Sketch
OVERVIEW
Smart microscope is the one that displays digital slides of the tissue, but has the user interface and physical knobs of a traditional microscope. The efficiency of traditional microscopy, but with the power of digitized whole slide images and machine learning. This project is what I am doing in the DALI lab at Dartmouth College.